

Water monitoring information portal quick start guide
This guide provides step-by-step instructions to view the trial rainfall data on the Water monitoring information portal (WMIP).
Trial participants will be notified of new functionality, as it is released.
Please note: All data used in this document is test data only.
-
Connectivity and browser requirements
A reliable internet connection is required to access the WMIP to view the trial rainfall data.
Using a tablet, laptop or desktop computer will provide the optimal user experience. The mobile version of the website available from a smart phone, provides a modified experience.
- Using the latest version of the Edge, Chrome or Firefox web browser is recommended.
-
The rainfall data captured during the trial is available in the WMIP. Access the WMIP on any internet-enabled device at the following link: https://water-monitoring.information.qld.gov.au.
On the home page, use the left-hand navigation pane to locate the Rainfall gauge satellite trial (Enhanced measurement project).
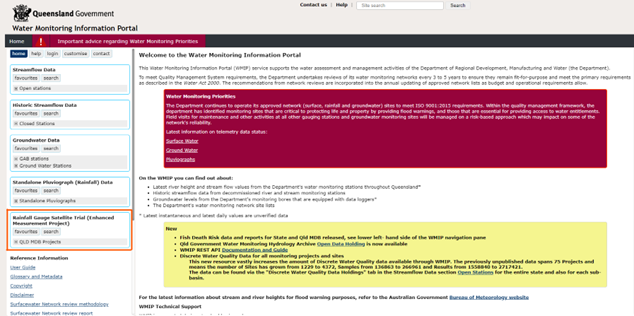 Figure 1: WMIP home page
How to find data for a specific trial site
- Click the plus (+) symbol to expand the list of trial sites.
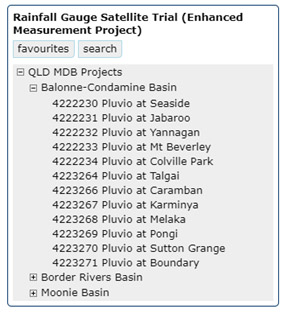 Figure 2: WMIP displaying an expanded list of data collection sites.
 - Click on site location to view the available data. The data will be displayed on the right-hand side of the screen.
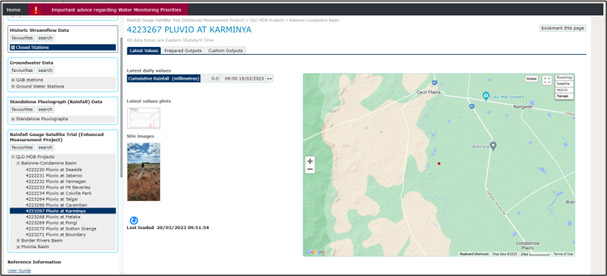 Figure 3: WMIP displaying rainfall information for an example trial site.
Available information
Latest values
- (Daily) cumulative rainfall (mm).
- Latest values plots.
- Click on the image to display the latest values in graph format.
- Site image
- Click on the site image to view the installed trial rain gauge.
Prepared outputs
- Site details summary report.
- Monthly rainfall report.
Custom Outputs
- Generate customised reports for a specific date range.
- Specify the frequency of the report.
- Download the report in a table or excel spreadsheet.
Data collection frequency
To optimise power supply the device is programmed to send the rainfall data from the gauge to the low orbiting satellites up to four times a day. The data is automatically sent to the WMIP and refreshed at least every 48 hours. For example, if it rains today at your site, you can expect to see the latest daily value for the site between 24 and 48 hours later.
- Click the plus (+) symbol to expand the list of trial sites.
-
For any issues accessing the rainfall gauge data in the WMIP, or assistance with the physical device, contact us by email raingaugetrial@itp-qld.atlassian.net
In the subject line of the email please include the device owner station name and a brief issue summary. Include a detailed description of the issue or support being sought in the email body.
![]()
The Queensland Department of Regional Development, Manufacturing and Water (DRDMW) gratefully acknowledges the Australian Government’s financial contribution to the Rural Water Futures Program through the Murray-Darling Basin Authority and the Murray-Darling Basin Communities Investment Package, delivered under the Murray-Darling Basin Plan by the Queensland DRDMW, through funding from the Australian Government Department of Climate Change, Energy, the Environment and Water.
Last updated: 11 Apr 2023